
Practice Comparing LLM Model Routes by Quality, Latency, and Cost
The cheapest route on the pricing page is often the most expensive one in production.

Key topics
The cheapest route on the pricing page is often the most expensive one in production.
A builder swaps in a smaller model because the per-token price looks better, ships it, and then watches the real bill climb anyway — more retries, more fallbacks, more post-processing, more human review. The token price went down. The cost per finished task went up. That gap is the entire reason this exercise exists.
By the end of this article, you will have run a small fixed task set through a few candidate routes, scored the outputs against a quality bar you wrote before you saw any results, and made a defensible keep-or-reject call on one routing rule. If you already know what routing is and why quality, latency, and cost pull against each other, that is enough background. We are going straight to the experiment.
Define the Experiment Before You Touch a Model
The most common way this comparison goes wrong is that it starts with running models instead of defining the question. You get a pile of outputs, you read them, you form an impression, and the impression becomes the conclusion. That is not measurement. That is a vibe with a spreadsheet attached.
Fix four things first.
The task set. Pick roughly 8–15 prompts drawn from real traffic or a realistic proxy. Not the easy cases. Not the showcase cases. The ones that actually show up. If your product classifies support tickets, use real tickets — including the messy, ambiguous, multi-intent ones. Easy prompts make every route look good and hide the exact boundary you are trying to find.
The quality bar. Write it before you run anything, as a pass/fail or scored rubric per task. For structured tasks, the bar is a contract: does the output validate against the schema, contain the required fields, and use allowed values? For open-ended tasks, write two or three explicit criteria and decide what counts as passing. The point of writing it first is that you cannot move the goalposts after you see the outputs.
The candidate routes. Two or three is enough. A cheap default, a premium route, and optionally a rule-based split between them. Keep the set small enough that you can compare the results by hand and still trust your reading.
The hypothesis. Name the routing rule you are testing as a sentence you could be wrong about: "Short classification tasks go to the small model; everything else goes to the large one." Then state what would make you reject it. If you only define the success condition, you have already decided the answer.
Common mistake: Choosing the task set after seeing which prompts the cheap model handles well. That is not a task set. That is a highlight reel.
Knowledge check
Check your understanding
Answer this question before you continue.
Set Up the Harness and Record the Right Fields
The harness should be dumb and inspectable. A script that loops over tasks × routes and writes one row per call to a file or table beats a framework you have to debug before you can debug your models.
The loop is simple:
for task in tasks:
    for route in routes:
        start = time.perf_counter()
        result = call_route(route, task.prompt)   # fixed template, fixed params
        elapsed = time.perf_counter() - start
        record(
            route=route.name,
            task_id=task.id,
            output=result.text,
            ttft=result.time_to_first_token,
            latency=elapsed,
            input_tokens=result.usage.input,
            output_tokens=result.usage.output,
            cost=estimate_cost(route, result.usage),
            retried=result.retried,
            fell_back=result.fell_back,
        )
Two things make this loop trustworthy. First, the prompt template and parameters are fixed across routes — the only variable is the route itself. If you tune the prompt for one model and not another, you have confounded the model with the prompt and your comparison is worthless. Second, you log the retry and fallback path explicitly. A route that silently falls back to a different model is not the route you think you measured. If your gateway hides that, turn on the logging before you start.
A few environment assumptions worth writing down: API keys and rate limits, whether you are measuring a provider's queue or your own, and whether any caching layer is active. Caching will make a route look faster and cheaper than it is on a cold request, which is fine if you know it is happening and wrong if you do not.
Knowledge check
Check your understanding
Answer this question before you continue.
Score Quality Against the Threshold, Not Against Vibes
Now apply the rubric you wrote in step one. For structured tasks, validate against the schema or contract rather than reading for plausibility. A confident, well-formatted, wrong answer should fail. That is the whole point of writing the bar down first.
For open-ended tasks, use a small set of explicit criteria or a judge model with a fixed prompt — and spot-check the judge against your own reading on a handful of outputs. Judges drift, and a judge you never audited is just a second opinion wearing a lab coat.
Report quality as pass rate per route, and note which tasks each route failed. Failure patterns matter more than the average. A route that passes 90% of tasks but fails the same category every time is telling you exactly where the routing boundary should be. A route that passes 90% by failing randomly is telling you something different and more dangerous.
The most useful column in your results is the one nobody plans for: tasks where the cheap route matched the premium route exactly. Those are your routing candidates. If the cheap model produces the same passing output as the premium model on a task, you have found a place where the premium route is buying you nothing.
Compute Cost per Successful Task
Token price is a per-unit input. It is not the number you care about. The number you care about is:
cost per successful task = (all attempt costs, including retries and fallbacks) ÷ (tasks that passed the quality bar)
This denominator is the one that reflects production economics, because a task that fails still cost you money. A cheaper model that needs two attempts and a fallback can easily cost more than the premium route it was supposed to beat — you paid for the first attempt and the fallback, and you paid in latency too.
Include routing-layer overhead if you use a gateway, and note whether it is per-request or a platform fee. Then separate interactive latency from batch latency. A route that is perfectly fine for an async job may be unusable in a user-facing path, and averaging the two together hides that.
Report latency as a distribution, not a single average. A fast mean with occasional spikes is a different product than a stable slower one. For interactive work, the p95 often matters more than the median, because that is the request your user remembers.
Knowledge check
Check your understanding
Answer this question before you continue.
Work Through a Small Result Set
Numbers make the decision method concrete. Here is a compact illustrative run: 10 tasks, a cheap default route, and a premium route, with a predeclared quality bar of 80% pass rate and a p95 latency ceiling of 2.5 seconds for the interactive path.
| Route | Pass rate | Median latency | p95 latency | Cost / successful task | Fallback rate |
|---|---|---|---|---|---|
| Cheap default | 7/10 (70%) | 0.9s | 2.1s | $0.004 | 10% |
| Premium | 10/10 (100%) | 1.8s | 2.4s | $0.031 | 0% |
The cheap route fails the quality bar outright. But look at which tasks it failed: all three failures were multi-intent classification prompts — tickets that contained two requests in one message. Every single-intent task passed. That is a pattern, not noise, and it points directly at a routing boundary.
Now test the rule: "Multi-intent classification goes to the premium route; everything else goes to the cheap route." Recompute the blended numbers for that split:
| Route | Pass rate | Median latency | p95 latency | Cost / successful task | Fallback rate |
|---|---|---|---|---|---|
| Rule-based split | 10/10 (100%) | 1.1s | 2.4s | $0.011 | 0% |
The split passes everything, stays under the latency ceiling, and costs roughly a third of the all-premium route. That is a keep. The rule earns its complexity because it fixes a specific, repeatable failure — not because it saves money in the abstract.
Note: These numbers are illustrative, not benchmarks. The point is the method: a predeclared bar, a failure pattern, a candidate rule, and a re-measured result. Your own run will produce different figures, and that is fine.
Knowledge check
Check your understanding
Answer this question before you continue.
Read the Results as a Tradeoff, Not a Scoreboard
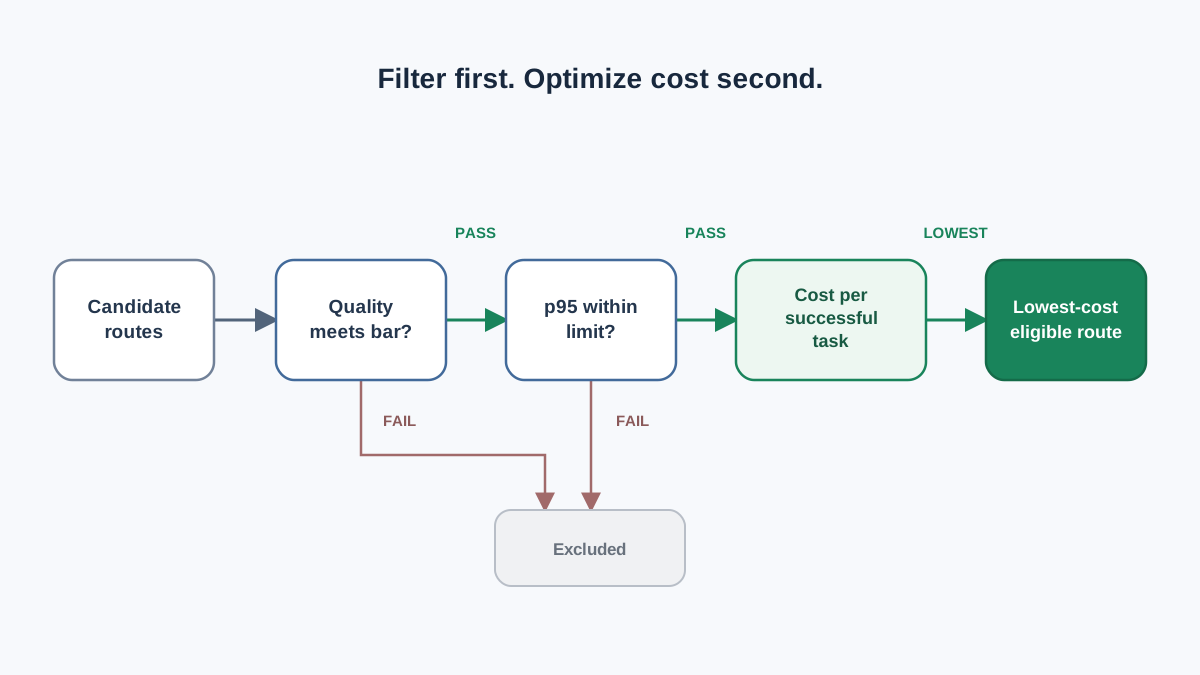
There is no winning row. There is a decision boundary, and your job is to find it.
Look for the task type where the cheap route's pass rate drops below your threshold. That drop is where the rule must escalate. If the cheap route passes everything, you may not need routing at all — that is a valid and genuinely useful result, and it saves you from building a routing layer that earns nothing. If the cheap route fails unpredictably, scattered across task types with no pattern, a rule-based split may be worse than simply paying for the premium route, because you cannot write a condition that catches the failures.
This is where small task sets bite you. With 8–15 tasks, a single pass or fail moves the pass rate by several points. A route that looks 7% better may just have gotten lucky on one prompt. Treat close calls as unresolved, not as wins, and do not ship a routing rule on a margin smaller than your measurement noise.
Note: The goal is not to prove the cheap route works. The goal is to find out whether it works for the tasks you would actually send it. Those are different questions, and only one of them is worth shipping on.
Failure Modes That Invalidate the Experiment
These are the specific ways this comparison quietly produces the wrong answer.
A non-representative task set. Easy prompts make every route look good and hide the boundary you are trying to find. If every route passes everything, your task set is too easy, not your models too good.
Moving the quality bar after seeing outputs. This turns measurement into rationalization. The bar goes in writing before the first call.
Ignoring retries, fallbacks, and post-processing. This understates the cheap route's true cost and overstates its speed. Every retry is money and milliseconds you did not budget for.
Comparing routes with different prompts or parameters. This confounds the model with the prompt. Fix the template, fix the parameters, change one thing.
Trusting a single run. Provider load, caching, and rate limits shift latency between runs. Repeat the loop before you commit, and if the numbers move a lot, you have learned something about the route's stability, not just its speed.
Ship the Rule, Then Re-Measure It
If the rule survives, encode it as a small, readable condition with an explicit fallback path and a logged reason for every routing decision. You want to be able to answer "why did this request go to the expensive model?" six weeks from now without guessing.
Then set a review trigger. A drop in pass rate, a rise in fallback rate, or a cost shift that changes the economics should pull you back to the harness. Keep the task set and the harness as a reusable regression check you can rerun whenever a model version changes — because it will.
A routing rule is a hypothesis with an expiry date, not a permanent configuration. Models get better, prices move, and the boundary you found today is a snapshot of today's market. The rule that was correct last quarter can quietly become the reason your costs crept up.
So the decision rule, stated plainly: never choose a route on token price alone. Choose it on cost per successful task at your quality bar, with latency measured as a distribution rather than an average. When the cheap route passes everything, you have earned the right to skip routing. When it fails unpredictably, you have earned the right to stop optimizing.
Your next move is small and concrete: rerun the same harness with one added route, or widen the task set by a handful of harder prompts. Either one sharpens the boundary. Then treat the rule as a hypothesis you re-test the moment a model version or a price changes — because the moment you stop measuring, the pricing page starts making your decisions for you.
Knowledge check
Final check
Finish the article by checking the ideas you just learned.
References
Want a more structured LLMOps path?
Use the LLMOps Practical Starter Bundle to connect RAG, evaluation, observability, and production patterns.
Large Language Models Starter Pack
A 12-chapter guide connecting LLM fundamentals with prompting, RAG, agents, tool calling, evaluation, security, and application engineering.
- 227-page Illustrated PDF edition
- 12 guided LLM engineering chapters
- Visual concept diagrams
- Self-assessment quizzes
- Bonus deep-dive sections
- Prompt design, structured output, context windows & RAG pipelines
- Agents, tool calling, prompt injection, evaluation & application lifecycles
Coming soon


