
Calculate Reliability Across an LLM Request Lifecycle
Your validation step passes. Retrieval returns documents. The model answers. Verification approves. Four green checkmarks, and the feature still fails on…

Key topics
Your validation step passes. Retrieval returns documents. The model answers. Verification approves. Four green checkmarks, and the feature still fails on roughly one request in four.
That gap is not bad luck. It is arithmetic, and most teams never write it down.
Why "95% Reliable" Stages Produce a 77% Reliable Feature
Picture a support-answer pipeline with four stages. Validation checks that the incoming question is well-formed and in scope. Retrieval pulls candidate documents from a knowledge base. The model generates an answer from those documents. Verification checks that the answer is grounded in the retrieved evidence before it reaches the user.
Each stage looks fine in isolation. Validation rejects only obvious garbage. Retrieval usually finds something relevant. The model usually produces a coherent answer. Verification usually catches the worst outputs.
Now count what "usually" costs you. If each stage succeeds about 90-95% of the time, the feature succeeds far less often than any single stage. The failures do not average out. They accumulate.
The weak mental model here is treating reliability as one number — "our pipeline is about 93% reliable" — derived by eyeballing the stages or averaging them. Averaging is the wrong operation. A request only reaches the model stage if validation and retrieval both succeeded. A request only reaches verification if the model produced something to verify. Each stage is a gate, and gates multiply.
That is the reframe for this article: end-to-end reliability is a multiplication problem, and multiplication has a bottleneck. Once you can write the product, you can find the bottleneck, and you can test whether fixing it is worth the engineering time.
Define the Success Event Before You Define the Probability
A probability is only as good as the event it describes. Before any math, name the events.
Let be the end-to-end success event: the user receives a correct, grounded answer. Break it into four stage events:
- — validation succeeds
- — retrieval succeeds
- — the model call succeeds
- — verification succeeds
Now the hard part, and the part teams skip. What does "succeeds" mean for each stage?
For validation, success means the request passed an explicit contract: the input parsed, the language was supported, the question was in scope. For retrieval, success means at least one retrieved chunk actually contains evidence relevant to the question. For the model, success means the generated answer addresses the question using that evidence. For verification, success means the answer's claims are supported by the retrieved context.
Notice what is missing from those definitions: HTTP status codes. A stage can return 200 and still fail its actual job. Retrieval can return ten documents that are all topically adjacent and none of them useful. The model can produce fluent, confident prose that answers a slightly different question. Verification can approve an answer because the checker was lenient.
Common mistake: Defining stage success as "the stage ran without throwing an exception." That definition measures your infrastructure, not your pipeline. The event definition, not the status code, determines the number you get.
This builds on the request-lifecycle stages you already know — validation, context assembly, model call, verification. Here we only need the stage boundaries, not a full trace. One assumption to state up front: the stages run in sequence, and each stage's success is judged by a defined check rather than by whether it completed.
Knowledge check
Check your understanding
Answer this question before you continue.
Derive End-to-End Success as a Product of Conditional Probabilities
Start with the joint probability that all four stages succeed:
Expand it with the chain rule, one factor at a time:
Read each factor as a mechanism, not a symbol.
is just the chance validation passes. asks: given that the query passed validation, what is the chance retrieval finds relevant evidence? That conditioning is real. A query that barely survived validation — ambiguous, oddly phrased — is exactly the query retrieval struggles with. asks: given a valid query and relevant evidence, what is the chance the model uses that evidence correctly? And asks: given everything upstream, what is the chance verification correctly approves the result?
This chain-rule form is exact. It holds for any set of events, correlated or not. The cost is that each factor is a conditional probability, and conditional probabilities are harder to estimate than simple per-stage rates.
That is where the simplifying assumption comes in. If each stage's success depends only on the previous stage succeeding — not on the full history — the chain collapses to:
where are the per-stage success probabilities. This is the independence assumption, and it is a choice, not a fact. It buys you a calculation you can actually do from per-stage measurements. We will stress-test it shortly.
Knowledge check
Check your understanding
Answer this question before you continue.
Worked Example: Four Stages, One Number
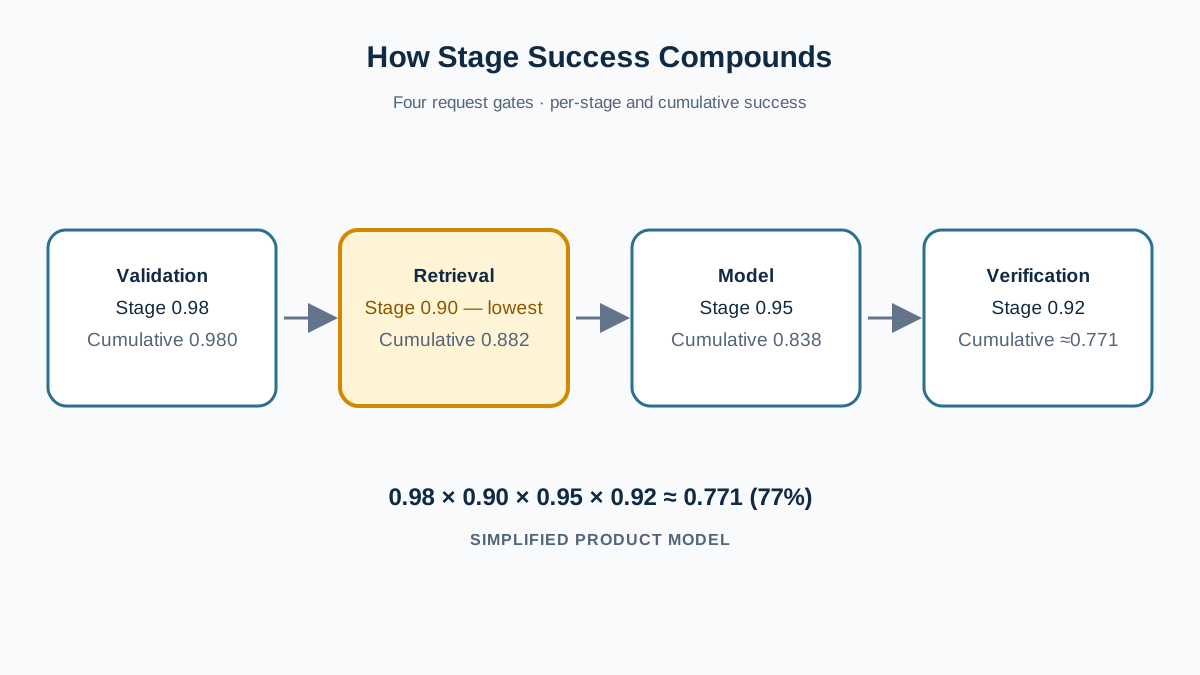
Assign plausible numbers to the support-answer pipeline, treating each as a per-stage success rate measured from traces:
| Stage | Symbol | Probability |
|---|---|---|
| Validation | 0.98 | |
| Retrieval | 0.90 | |
| Model | 0.95 | |
| Verification | 0.92 |
Multiply:
Step by step: . Then . Then .
End-to-end success is about 77%. Roughly one request in four fails somewhere along the chain, even though no single stage drops below 90%.
Sit with the gap. The best stage is 98%. The product is 77%. That 21-point spread is where the compounding lives, and it is invisible if you only look at stages one at a time.
[validate 0.98] → [retrieve 0.90] → [model 0.95] → [verify 0.92] → P(S) ≈ 0.77
The product is dominated by its smallest factor. Retrieval at 0.90 drags hardest, which is why the weakest stage deserves the first look — not because it is broken, but because it is the current bottleneck.
Knowledge check
Check your understanding
Answer this question before you continue.
Where the Independence Assumption Breaks
Conditional probability asks, "given that the previous stage succeeded, what happens next?" Independence assumes the stages do not influence each other at all. Those are different claims, and the difference has teeth.
Consider correlated failure. When retrieval returns weak or irrelevant evidence, the model is more likely to hallucinate — it has nothing solid to ground on, so it fills the gap. That means is not a fixed 0.95. It moves with retrieval quality. On requests where retrieval failed, the model's success rate is lower than on requests where retrieval succeeded.
Why this matters numerically: correlated failures cluster instead of canceling. If retrieval failures and model failures tend to land on the same requests, the true end-to-end rate can be worse than the naive product suggests. The product assumes each stage fails independently, spreading failures evenly. Reality can concentrate them.
Note: The product form is a useful first model and a diagnostic tool. It is not a guarantee of your real rate. Treat it as a ranking device, not a prophecy.
What to do instead of assuming: measure stage outcomes per request, then check whether failures co-occur. If retrieval failures and verification failures show up on the same traces far more often than chance would predict, your stages are correlated and the product is optimistic. That is a finding worth acting on, not a rounding error.
Knowledge check
Check your understanding
Answer this question before you continue.
Change One Stage and Watch the Bottleneck Move
The calculation earns its keep when you use it to compare fixes. Start from the baseline of 0.77 and improve retrieval from 0.90 to 0.97:
That is a jump from 77% to about 83% — roughly six points. Now try the same seven-point improvement on validation instead, from 0.98 to 1.00 (an unrealistic ceiling, but useful as a bound):
About 79%. A perfect validation stage buys you two points. A better retrieval stage buys you six.
Equal-sized improvements do not produce equal end-to-end gains. The marginal return depends on the other factors. Validation was already near its ceiling, so there was little left to win. Retrieval had room, and it was the smallest factor, so improving it moved the product most.
That gives you a decision rule: spend effort on the stage whose improvement moves the product most, not on the stage that feels most broken. Feelings track visibility. The product tracks leverage.
This is also how you evaluate a proposed control before you build it. A verification gate, a retry, or a fallback path changes exactly one factor. Estimate the new factor first, recompute the product, and compare the gain to the cost. If a retry lifts retrieval from 0.90 to 0.93, you can predict the end-to-end effect before writing a line of code.
Warning: Improving a stage you cannot measure just moves the guess, not the reliability. If you have no per-stage data, you are tuning a number you invented.
When This Calculation Helps and When It Misleads
Use the product when three conditions hold: the stages are genuinely sequential, each stage has a definable success check, and you can estimate per-stage rates from traces or samples. Under those conditions it is a fast, honest ranking tool.
Do not lean on it when stages run in parallel, when retries and fallbacks make the path non-linear, or when you have no per-stage measurement at all. A retry loop, for instance, means a request can succeed on the second attempt — the clean product no longer describes the path.
Two mistakes show up constantly. The first is multiplying vendor SLA numbers or marketing percentages as if they were your stage probabilities. A provider's uptime figure describes their infrastructure, not your retrieval quality or your verification accuracy. The second is treating the product as a precise prediction. It is not. It is a way to order your options.
The value is the ordering it produces, not the decimal it prints.
Make It a Habit
The whole method fits in four moves. Write the success events for each stage against an explicit contract. Estimate each conditional factor from real traces rather than intuition. Multiply to get the end-to-end figure. Then perturb one factor and see where the leverage is.
Do that before your next fix. Pick one stage of a pipeline you already run — retrieval is usually the honest starting point — and instrument it so you can measure its actual success rate per request. Once you have that number, recompute the product. You will likely find that the stage you were about to rewrite is not the one holding the feature back.
Knowledge check
Final check
Finish the article by checking the ideas you just learned.
Want a more structured LLMOps path?
Use the LLMOps Practical Starter Bundle to connect RAG, evaluation, observability, and production patterns.
Large Language Models Starter Pack
A 12-chapter guide connecting LLM fundamentals with prompting, RAG, agents, tool calling, evaluation, security, and application engineering.
- 227-page Illustrated PDF edition
- 12 guided LLM engineering chapters
- Visual concept diagrams
- Self-assessment quizzes
- Bonus deep-dive sections
- Prompt design, structured output, context windows & RAG pipelines
- Agents, tool calling, prompt injection, evaluation & application lifecycles
Coming soon


