
LLM API Rate Limits: Calculate Request and Token Capacity
At 9:05 a.m., your dashboard says you are fine. Your daily average sits comfortably inside the published limits. Then the 429s start.

Key topics
At 9:05 a.m., your dashboard says you are fine. Your daily average sits comfortably inside the published limits. Then the 429s start.
The average was never the thing being enforced. A rate limit is a constraint on a window, not on a day, and the window does not care that yesterday was quiet. What follows is a way to compute your real capacity from two independent limits, find which one actually binds, and understand why a burst can break a workload whose long-run average looks healthy.
Two Clocks, One Ceiling
A provider enforces at least two separate counters: a request-per-time limit that counts calls, and a token-per-time limit that counts work. They are not one combined budget. A request with a 40,000-token prompt costs one request and 40,000 tokens, and each counter moves independently.
That matters because your capacity is not the sum of what the two limits allow. It is the smaller of the two. Whichever runs out first governs everything you can do, and the other limit is irrelevant until you change the shape of your workload.
If you have already sent a programmatic request and read the usage fields in the response, you have the raw material for this. The next step is sizing.
Limits exist because inference capacity is shared. Providers enforce windows to keep one tenant from starving the others, to keep latency predictable, and to blunt abuse. That is also why a single "our limit" number is usually wrong: limits are typically scoped per model, per account tier, and sometimes per endpoint. A limit you read for one model tells you nothing about another.
Knowledge check
Check your understanding
Answer this question before you continue.
Write Down the Workload Before You Calculate Anything
Every capacity number is only as good as the workload model behind it. So define the notation first.
- R — requests per unit time
- T_in — input tokens per request
- T_out — output tokens per request
- W — the length of the limit window, in seconds
- L_r — the request limit for that window
- L_t — the token limit for that window
Four assumptions decide the answer:
- Average request size. Not the median. If your p95 request is three times the median, sizing from the median will undercount your token burn by a wide margin.
- Output length distribution. Output tokens are generated serially, so they dominate wall-clock latency even when they are a small share of the counter.
- Arrival pattern. Steady traffic and spiky traffic produce the same daily average and completely different failure behavior.
- Whether retries and failed calls count. They usually do.
That last point deserves its own line. Failed requests typically still consume request quota but report no tokens. A retry loop can therefore drain your request budget while the token dashboard looks perfectly healthy — the two counters disagree about whether anything happened.
Common mistake: Budgeting only input tokens. The model's own output is charged against the same window, and for reasoning-style workloads the output side can be the larger half.
Knowledge check
Check your understanding
Answer this question before you continue.
Bound One: How Many Requests Fit in the Window
Start with the simpler counter. If the request limit is L_r per window W, then the maximum sustainable request rate is:
max requests per second = L_r / W
A 500 requests-per-minute limit means 500 / 60 ≈ 8.33 requests per second sustained. That is a ceiling, not a target — you want headroom below it, because retries, health checks, and background jobs all draw from the same counter.
Translated into user-facing terms: at one request per user action, that is roughly eight concurrent user actions per second. Subtract your retry traffic and your monitoring probes before you call it eight.
What this bound ignores is everything about the work itself. It says nothing about how long each request takes or how many tokens it burns. It is a count of door openings, not a measure of what walks through.
Common mistake: Treating the request limit as the real limit. For most LLM workloads it is not even close to binding.
Knowledge check
Check your understanding
Answer this question before you continue.
Bound Two: How Many Tokens Fit in the Window
Now the counter that usually decides the answer. Each request consumes T_in + T_out tokens, so the token-side capacity is:
max requests per window = L_t / (T_in + T_out)
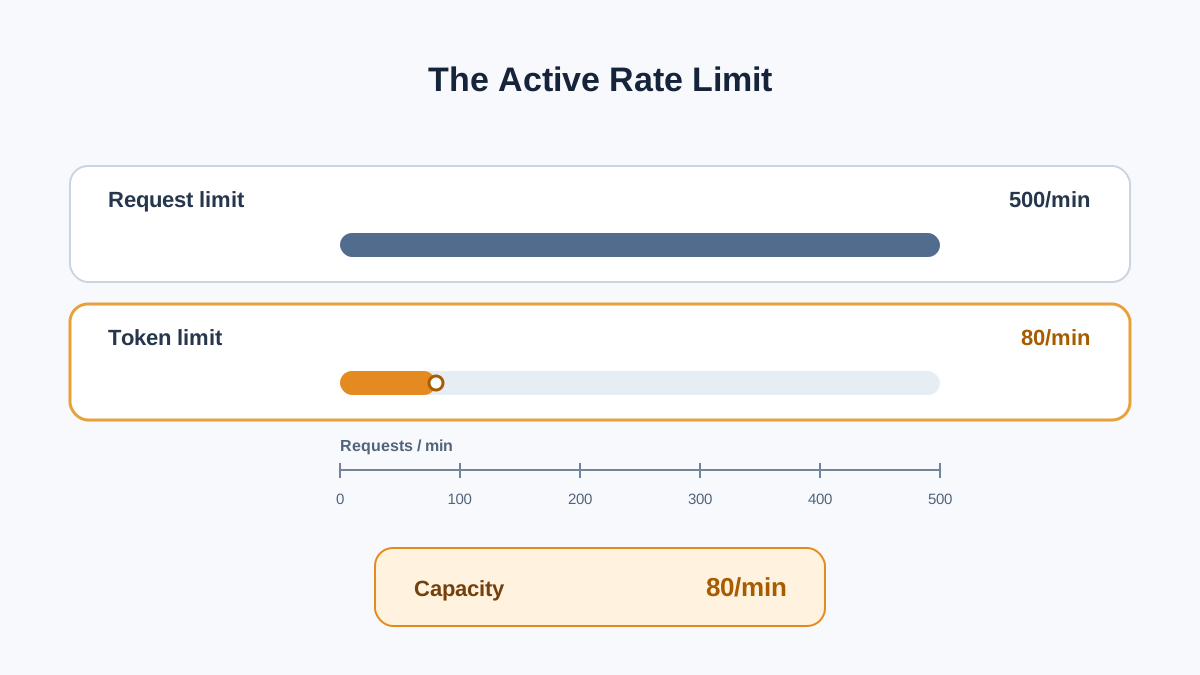
Work it through. Suppose the token limit is 200,000 tokens per minute, and a typical request carries 2,000 input tokens and produces 500 output tokens. Each request costs 2,500 tokens:
200,000 / 2,500 = 80 requests per minute
Eighty. Against a request limit of 500 per minute. The token limit is consuming 80% of your capacity, and the request limit is sitting there mostly unused.
This is the normal case, not the exception. Long context, retrieved documents, and reasoning traces inflate T_in and T_out without changing the request count at all. You can send the same number of calls and burn ten times the tokens.
There is a useful asymmetry here. Output tokens are the expensive half in latency terms, because they are produced one after another. Input tokens are the expensive half in counter terms for retrieval-heavy workloads, because you pay for every document you paste into the prompt whether or not the model uses it.
Common mistake: Forgetting that output tokens are charged against the same window as input. A workload with a 1,000-token prompt and a 4,000-token answer costs five times what the prompt suggests.
Knowledge check
Check your understanding
Answer this question before you continue.
Find the Active Constraint
The two bounds live in different units — one is a rate per second, the other is a count per window. To compare them, convert the token bound into a rate by dividing by the same window length W:
token-side rate = L_t / (W × (T_in + T_out))
Now both sides are requests per second, and the units cancel cleanly: tokens per window divided by (seconds per window × tokens per request) leaves requests per second. Combine them and you get your real capacity:
capacity = min( L_r / W , L_t / (W × (T_in + T_out)) )
The smaller number is the one that governs. Here is a repeatable procedure:
- Compute the request-side capacity.
- Compute the token-side capacity.
- Compare them and name the winner — that is your active constraint.
- State your headroom as a percentage of the binding limit, not the other one.
The two workload shapes behave differently, and the fix depends on which one you are in:
| Workload shape | Likely active constraint | What helps |
|---|---|---|
| Many short calls, small prompts | Request rate | Batching, caching, fewer redundant calls |
| Few large calls, long context | Token rate | Trimming context, shortening outputs, splitting work |
| Mixed | Whichever you measure | Measure both; do not guess |
If you are request-bound, the lever is call count. If you are token-bound, the lever is tokens per call. Applying the wrong fix is a common and expensive mistake: trimming context does nothing for a request-bound workload, and batching does nothing for a token-bound one.
Picture two horizontal bars drawn against the same window. The shorter bar is your capacity. Everything else is commentary.
Why a Burst Breaks an Acceptable Average
Here is the part that produces the 9:05 a.m. surprise.
A limit is enforced over a window, not over a day. A daily average of 40 requests per minute tells you nothing about the 300 requests that arrive in a single minute. The average is a description of the past; the window is a constraint on the present.
The enforcement algorithm changes where the failure lands, but not whether it happens:
- Fixed windows reset at a clock boundary. A burst that straddles the boundary can consume nearly two windows' worth of quota in a short span — full allowance at 11:59:59, full allowance again at 12:00:00.
- Sliding windows smooth the boundary spike by summing sub-buckets over a rolling period. The spike is bounded, but a large enough burst still fails.
- Token buckets refill at a set rate and let each request spend from the bucket. A burst succeeds up to the bucket depth, then throttles to the refill rate. This is why the first spike sails through and the second one, minutes later, does not.
The practical consequence is blunt: size for peak arrival rate, not average. If your peak minute exceeds the active bound, the average will not save you. You need an explicit queue, a backoff policy, or a workload change — not a hope that the quiet hours balance out the busy ones.
When This Calculation Is Enough — and When It Is Not
This model is good for rough sizing, choosing between architectures, deciding whether to batch or trim context, and setting internal budgets. It is not a 429 predictor.
Three things sit outside the model:
- Enforcement details. The exact algorithm, the bucket depth, and the boundary behavior are provider decisions you do not control.
- Shared quota. If multiple services share one key or one account, the limit is not yours alone. The noisiest caller sets the ceiling for everyone.
- Tier and policy changes. Published limits move with tier, model, and provider policy. Treat the numbers as inputs you re-check, not constants.
Note: A token limit is a throughput control, not a cost control. The same token count costs different amounts on different models, and it moves whenever a provider reprices.
The decision rule is simple. If your peak arrival rate exceeds the active bound, you need queueing, backoff, or a second route. A bigger average will not help, because the average was never the constraint.
Your Next Move
Take your own workload numbers — requests per minute at peak, average input tokens, average output tokens — and compute both bounds. Name the active constraint out loud. Then compare your peak-minute arrival rate against it, not your daily average.
If peak exceeds the bound, the next step is not a limit-increase request. It is a queue, a backoff policy, or a workload change aimed at whichever bound is actually binding. Compute first. Then fix the right thing.
Knowledge check
Final check
Finish the article by checking the ideas you just learned.
References
Want a more structured LLMOps path?
Use the LLMOps Practical Starter Bundle to connect RAG, evaluation, observability, and production patterns.
Large Language Models Starter Pack
A 12-chapter guide connecting LLM fundamentals with prompting, RAG, agents, tool calling, evaluation, security, and application engineering.
- 227-page Illustrated PDF edition
- 12 guided LLM engineering chapters
- Visual concept diagrams
- Self-assessment quizzes
- Bonus deep-dive sections
- Prompt design, structured output, context windows & RAG pipelines
- Agents, tool calling, prompt injection, evaluation & application lifecycles
Coming soon


