
How Multimodal Inputs Use Model Capacity Beyond Text Tokens
You type a short question, attach one screenshot, and hit send. The words are maybe forty. The request behaves like it swallowed a page.

Key topics
You type a short question, attach one screenshot, and hit send. The words are maybe forty. The request behaves like it swallowed a page.
Nothing is broken. You are watching a budget you cannot see on screen.
Why the Visible Token Count Stops Being the Whole Budget
Most of us carry the same mental model: characters and words map to tokens, tokens map to context usage, done. That model is genuinely useful. For plain text, with one model and one tokenizer, it predicts behavior well enough to plan a prompt.
Then an image enters the request, and the visible text stops predicting the capacity consumed.
The reason is structural. A multimodal model does not read your image the way you do. It converts that image into a set of internal representations — patches, embeddings, vision tokens — and those representations occupy the same finite space as your words. Context is a finite resource with diminishing returns, so anything that consumes it matters, even when it never appears as text you can count.
I want to be honest about scope before we go further. This article builds a model of the accounting. It is not a lookup table of real vendor numbers, and you should not treat any figure below as a prediction of what your provider will charge or accept.
Knowledge check
Check your understanding
Answer this question before you continue.
Define a Capacity Unit Before Doing Any Arithmetic
To make the mechanism visible, we need a unit. Real systems expose different accounting surfaces, so I will define a deliberately hypothetical one.
Call it a capacity unit (CU): the model's internal accounting slot for one piece of input, text or otherwise. Think of it as a seat in a theater. Every seat is identical to the model, but different kinds of input claim different numbers of seats.
Now the assumptions, stated plainly so the arithmetic is checkable:
- One fixed total capacity per request.
- Consumption is additive — text plus image plus history, no overlap.
- No compression, pruning, or eviction of representations.
- One model, one encoder configuration, held constant.
Define the conversion factors as symbols:
- — capacity units consumed per text token.
- — capacity units consumed per image representation.
- — total capacity available for the request.
The relationship is simple: total consumption equals text tokens times , plus images times . Remaining capacity is minus that total.
Note: If the model compresses, prunes, or caches representations, this additive model becomes an approximation. It still explains the direction of the effect, but the exact number drifts.
Knowledge check
Check your understanding
Answer this question before you continue.
Worked Example: Text-Only Request vs. One Image
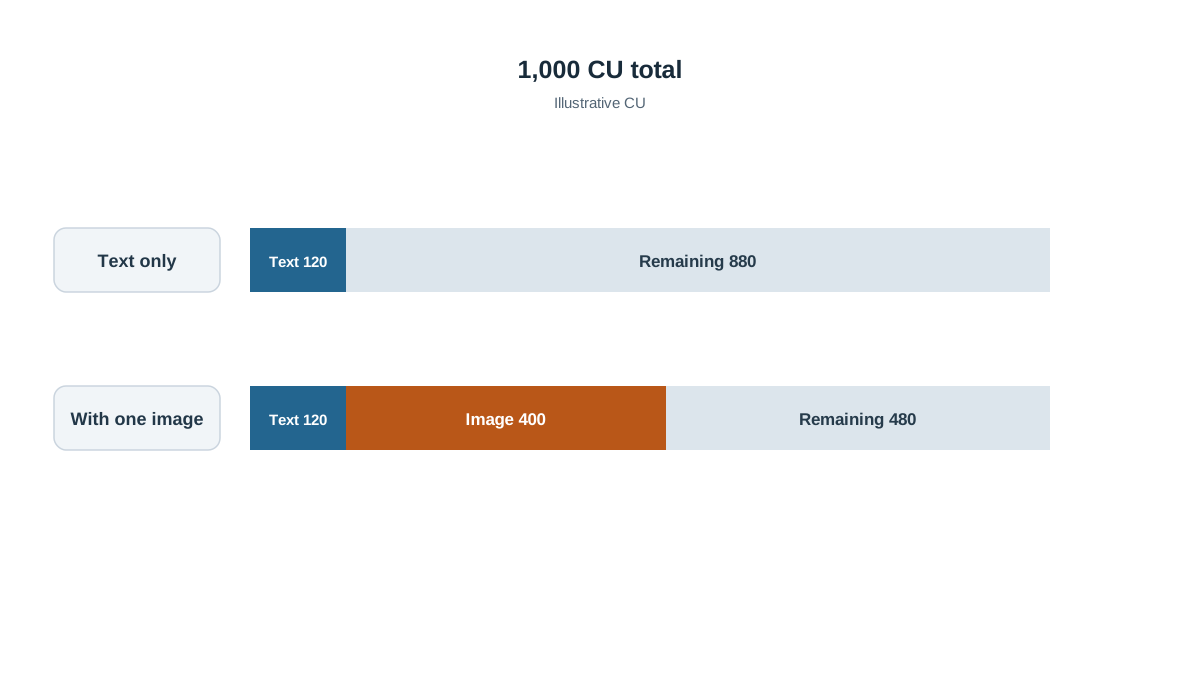
Here are illustrative assumptions. They are chosen to make the arithmetic clean, not to describe any real product.
| Symbol | Meaning | Illustrative value |
|---|---|---|
| Total capacity per request | 1,000 CU | |
| Capacity per text token | 1 CU | |
| Capacity per image representation | 400 CU |
Step 1 — Text-only request.
Suppose your prompt is 120 text tokens.
You have 880 CU left for history, retrieved documents, and the model's response.
Step 2 — Add one image.
Same 120 text tokens, plus one image representation.
Step 3 — Name the delta.
| Request | Text CU | Image CU | Total CU | Remaining CU |
|---|---|---|---|---|
| Text only | 120 | 0 | 120 | 880 |
| With one image | 120 | 400 | 520 | 480 |
The image displaced 400 CU — more than three times the entire text portion of the request. Your forty-word question was never the expensive part.
Step 4 — Translate remaining capacity into a consequence.
With 480 CU left, how much additional text fits before the request is truncated or rejected?
That sounds generous until you remember what competes for it: conversation history, retrieved documents, system instructions, and the model's own output. Add a second image and you spend another 400 CU, leaving 80 CU — barely enough for a short instruction, and nothing else.
Tip: Change one number and re-run it. Raise to 600 and the single-image request leaves only 280 CU. The mechanism does not change; the pressure does.
Knowledge check
Check your understanding
Answer this question before you continue.
What the Numbers Actually Predict About Behavior
The arithmetic earns its place only if it predicts something you can observe.
Capacity consumed by non-text input is capacity unavailable to instructions, retrieved documents, and conversation history. When that squeeze happens, you tend to see a recognizable cluster of signals:
- Context gets dropped or truncated.
- Instruction-following degrades — the model ignores a constraint you clearly stated.
- Prefill slows down because there is more to process before the first output token.
- Cost rises, because you are paying for representations you never typed.
- Answers quietly ignore earlier parts of the request.
The dangerous failure mode is the silent one. The request still succeeds. It returns a fluent answer built on less evidence than you assumed, and nothing in the response tells you that something got squeezed out.
Common mistake: Treating the image as a free attachment. When an image is central to the task, cut text elsewhere — trim history, drop marginal retrieved chunks, shorten the system prompt. Pay for the image by spending less somewhere else.
Picture a stacked bar for each case. The text-only bar is almost all headroom. The image bar is a thin text sliver, a fat image block, and a much shorter remaining segment. Same total width. Very different room to work.
Knowledge check
Check your understanding
Answer this question before you continue.
Why This Arithmetic Does Not Transfer Between Models
Here is where beginners get burned: they take a conversion rate from one explanation and apply it everywhere.
The conversion rate is a property of the model's encoder, its resolution handling, and its tokenizer. It is not a constant of nature. Change the model and you change — sometimes dramatically.
Three reasons the number moves:
Resolution and partitioning change the count. Higher-fidelity input generally produces more internal units. The growth is not linear in a way you can guess from pixel dimensions alone, because models partition images differently.
Accounting surfaces differ. The same image can look cheap in one interface and expensive in another, because each provider exposes a different view of consumption.
Compression, pruning, and caching shift the effective cost. The nominal count and the actual work done are not always the same thing.
So what can you safely generalize?
- Non-text input consumes capacity.
- It is usually larger than the visible text suggests.
- The only reliable number comes from the model or provider you are actually using.
Everything else is a thinking tool, not a fact.
When to Reason This Way — and When Not To
Use the capacity model when you are budgeting a prompt with images, audio, or video; when you are debugging truncated or ignored context; or when you are comparing cost across providers and need a consistent frame.
Do not use it when the request is text-only and your tokenizer already gives you a real count. Do not use it when you need a billing-accurate figure — that requires the provider's own accounting, not a hypothetical unit.
Two mistakes I see repeatedly:
Common mistake: Treating the illustrative conversion rate as a real constant and building a cost estimate on top of it. The estimate will be wrong in a direction you cannot predict.
Common mistake: Assuming a smaller image is proportionally cheaper without checking how the model handles resolution. Downscaling does not always reduce the count the way you expect.
The practical habit that survives all of this: measure once with your actual model, record the observed consumption, and use that as your working estimate. One real measurement beats ten borrowed assumptions.
The Next Move
Treat every non-text input as a capacity purchase, not a free attachment. That single reframe will change how you compose prompts with images, audio, or video.
Here is your concrete next step. Take a prompt you already use and trust. Run it text-only and note the behavior. Now add one image and run it again. Watch for the squeeze: does the model follow your instructions as tightly? Does it reference earlier context as reliably? Does the answer feel thinner?
If something got squeezed out, you just found the budget — not in a dashboard, but in the behavior. That observation is worth more than any conversion rate I could hand you, because it came from the model you actually run.
Knowledge check
Final check
Finish the article by checking the ideas you just learned.
References
Want a more structured LLMOps path?
Use the LLMOps Practical Starter Bundle to connect RAG, evaluation, observability, and production patterns.
Large Language Models Starter Pack
A 12-chapter guide connecting LLM fundamentals with prompting, RAG, agents, tool calling, evaluation, security, and application engineering.
- 227-page Illustrated PDF edition
- 12 guided LLM engineering chapters
- Visual concept diagrams
- Self-assessment quizzes
- Bonus deep-dive sections
- Prompt design, structured output, context windows & RAG pipelines
- Agents, tool calling, prompt injection, evaluation & application lifecycles
Coming soon


