
Calculate Whether an LLM Use Case Is Economically Worthwhile
The demo worked. The pilot looked fine. Then the invoice arrived, the review queue grew, and the savings quietly disappeared.

Key topics
The demo worked. The pilot looked fine. Then the invoice arrived, the review queue grew, and the savings quietly disappeared.
That pattern usually traces back to one weak comparison: model cost per call versus human cost per task. It feels quantitative, so it gets trusted. But it silently assumes the model handles every task correctly with zero supervision. Almost no real workflow works that way.
The real question is not whether the model is cheap. It is whether the whole workflow — coverage, review, corrections, escaped errors, and build cost — beats the baseline you already have. This article builds one break-even model you can defend, works it with explicit numbers, and then shows how a single changed assumption can flip the answer.
If you have not yet screened your candidate task for fit, that step comes first. Screening tells you a task is a candidate. This model tells you whether the candidate pays.
Why Cost Per Call Is the Wrong Number
The naive model looks like this:
savings per task = human cost per task − model cost per call
Multiply by volume, and the case looks obvious. The problem is what this equation hides.
Partial coverage. The model will not attempt every task. Some inputs are malformed, out of scope, or too ambiguous. Those tasks still cost you the baseline. If coverage is 60%, then 40% of your volume never touches the LLM at all.
Review and correction labor. Someone inspects outputs. Some outputs need rework. That labor scales with volume, and it is easy to forget because it lives in a different budget line than inference.
Escaped errors. Review is not perfect. Some wrong outputs reach a customer, a database, or a compliance file. The cost of those errors — refunds, rework, trust, regulatory exposure — never appears in a per-call price.
There is also a structural distinction that distorts decisions when ignored. One-time build and integration cost behaves like CapEx: bounded, paid once, amortized over a period. Inference, review, and maintenance behave like OpEx: they compound and scale with volume. Mixing them into a single monthly figure makes a project look cheap in month one and expensive in month twelve.
Note: This model compares an LLM workflow against a conventional or deterministic baseline. It does not choose between model architectures or vendors. That is a separate tradeoff question.
Define the Variables Before You Calculate
Every symbol below maps to something you can observe or estimate. Define them before touching arithmetic, because a formula you cannot trace back to reality is just decoration.
| Symbol | Meaning | How to estimate |
|---|---|---|
N | Tasks per period | Count from logs or tickets |
B | Baseline cost per task | Fully loaded labor plus overhead |
c | Automation coverage | Fraction the LLM attempts end-to-end |
m | LLM cost per attempted task | Tokens, retrieval, orchestration, hosting |
r | Review rate | Fraction of attempts a human inspects |
v | Review cost per inspected task | Time to read and approve |
k | Correction rate | Fraction of attempts needing rework |
w | Correction cost per rework | Time to fix and re-verify |
p_err | Error probability on unreviewed attempts | Measured or bounded |
E | Expected cost per escaped error | Rework, refunds, compliance, trust |
C0 | One-time build cost | Build, integration, evaluation, change management |
Two definitions deserve emphasis.
B is fully loaded. Salary alone understates the baseline. Add benefits, tooling, management overhead, and the cost of the current process's own errors. If you compare model cost against raw salary, you inflate savings before you start.
C0 needs an amortization period. State it explicitly — twelve months, twenty-four months, whatever matches your planning horizon. An unamortized build cost is a hidden subsidy.
Every variable here is an estimate with a range. The model is only as honest as the ranges you feed it.
Knowledge check
Check your understanding
Answer this question before you continue.
Derive the Break-Even Condition
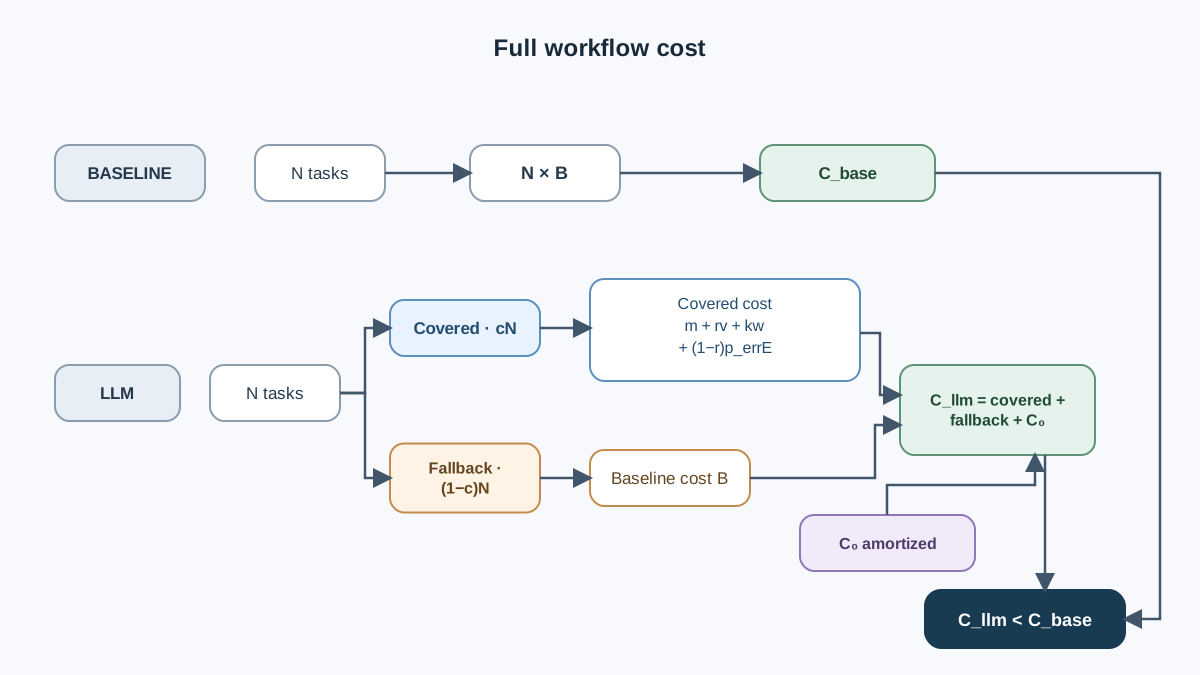
Start with the baseline. If nothing changes, you pay:
C_base = N × B
Now the LLM path. Each task falls into one of two groups. The fraction c the model attempts, and the fraction (1 − c) that still costs B:
C_llm = N × [c × (m + r·v + k·w) + (1 − c) × B] + error term + amortized C0
The bracket says: for attempted tasks, you pay inference, plus review on the inspected fraction, plus correction on the reworked fraction.
The error term covers mistakes that slip past review:
error term = N × c × (1 − r) × p_err × E
Read that carefully. (1 − r) is the fraction of attempts nobody inspects. p_err is the probability an unreviewed attempt is wrong. Their product is the escaped-error rate. Review and error probability interact: raising r shrinks the error term, but adds v per inspected task. That trade is the heart of the model.
The break-even condition is simply:
C_llm < C_base
To isolate coverage, subtract the baseline from both sides and solve for the threshold c* where the LLM path starts winning. The escaped-error cost belongs on the LLM side, so it subtracts from the per-task savings:
c* = (C0_amortized / N) / (B − m − r·v − k·w − (1 − r)·p_err·E)
The exact algebra matters less than what each term does. Higher B lowers the bar. Higher m, v, w, p_err, or E raises it. Higher C0 raises it, and higher N dilutes C0 toward zero.
Notice the sign on the error term. It is subtracted, because escaped errors erode the savings from each attempted task. If (1 − r)·p_err·E grows large enough, the denominator shrinks toward zero and then goes negative — meaning no coverage level makes the LLM path cheaper. That is the correct behavior: when error impact is severe, the workflow cannot win on volume alone.
In words: coverage must be high enough, review cheap enough, and error impact small enough that savings on automated tasks exceed the added supervision and build cost.
Warning: This derivation assumes review catches errors at a stated rate. If review is weak, the error term dominates and the model's optimism collapses. Test that assumption before trusting the result.
Knowledge check
Check your understanding
Answer this question before you continue.
Worked Example With Explicit Numbers
Hypothetical workflow: classifying and routing inbound support documents. All numbers below are illustrative, not benchmarks for any real vendor or process.
Assumptions:
N= 10,000 tasks per monthB= $6.00 fully loaded per taskc= 0.70 coveragem= $0.40 per attempted taskr= 0.30 review ratev= $1.50 per reviewk= 0.10 correction ratew= $4.00 per correctionp_err= 0.05 on unreviewed attemptsE= $40.00 per escaped errorC0= $18,000, amortized over 12 months
Baseline:
C_base = 10,000 × $6.00 = $60,000/month
LLM path, term by term:
attempted tasks:      10,000 × 0.70 = 7,000
inference:            7,000 × $0.40 = $2,800
review:               7,000 × 0.30 × $1.50 = $3,150
correction:           7,000 × 0.10 × $4.00 = $2,800
fallback to human:    3,000 × $6.00 = $18,000
escaped errors:       7,000 × 0.70 × 0.05 × $40 = $9,800
amortized C0:         $18,000 / 12 = $1,500
Total:
C_llm = $2,800 + $3,150 + $2,800 + $18,000 + $9,800 + $1,500 = $38,050/month
Per task: $3.81 versus $6.00 baseline. Net difference: $21,950 per month. Payback on C0 arrives in the first month.
Now check the coverage threshold. The denominator is $6.00 − $0.40 − $0.45 − $0.40 − $1.40 = $3.35. The amortized build cost per task is $1,500 / 10,000 = $0.15. So c* = $0.15 / $3.35 ≈ 0.045. The assumed c of 0.70 sits far above the line.
But notice which inputs are guesses. p_err, E, and k are almost always estimates. c and r should be measured. Flag the difference in your own model.
Knowledge check
Check your understanding
Answer this question before you continue.
Sensitivity: Which Assumption Flips the Decision
A single point estimate hides fragility. Vary one input at a time and recompute every term from the same equations.
| Scenario | Change | Monthly C_llm | Verdict |
|---|---|---|---|
| Base | As above | $38,050 | Wins by $21,950 |
| Low coverage | c = 0.40 | $50,600 | Wins by $9,400 |
| Weak review | r = 0.10, p_err = 0.15 | $60,200 | Loses by $200 |
| Low volume | N = 1,000 | $3,805 | Wins, but C0 payback stretches |
| Cheap baseline | B = $3.00 | $38,050 | Loses by $8,050 |
Three lessons fall out of this table.
Coverage is fragile. Drop c from 0.70 to 0.40 and the margin shrinks by more than half. Coverage is the input most likely to be overestimated before a pilot.
Cheap review that misses errors is worse than expensive review that catches them. In the weak-review row, lowering r saved $2,100 in review labor but added $12,600 in escaped-error cost. The interaction term is not a footnote.
Volume gates the build. At N = 1,000, the workflow still wins on paper, but C0 takes far longer to amortize. The same use case can be worthwhile at scale and wasteful at pilot scale.
The baseline is not frozen. If the current process gets cheaper or improves, the LLM case erodes with no change to the model at all.
Tip: Name the one or two inputs that dominate your verdict. If those are guesses, the model is a hypothesis, not a conclusion.
Knowledge check
Check your understanding
Answer this question before you continue.
Common Modeling Mistakes
Audit your own spreadsheet against these.
- Comparing model cost to salary instead of fully loaded baseline cost. This inflates savings before the first calculation.
- Assuming 100% coverage. Tasks that silently fall back to humans still cost
B. - Forgetting that review labor scales with volume. Review cost often grows as quality expectations rise, not shrinks.
- Treating
C0as free or as a one-month expense. Amortize it honestly over a stated period. - Ignoring error impact because it is hard to quantify. An unquantified risk is still a cost. Bound it, even roughly.
- Using a single point estimate with no range. This hides how fragile the conclusion is.
When This Model Fits and When It Does Not
Good fit: repetitive, high-volume tasks with a measurable baseline, a reviewable output, and a bounded error cost.
Poor fit: low-volume or one-off tasks where C0 never amortizes; tasks where error impact is catastrophic and uninsurable; workflows whose baseline is itself changing fast.
Common mistake: Applying this model to a task where a deterministic rule, a database lookup, or a simple script would do the job. If the task has no language ambiguity, the LLM is the wrong tool and no cost model will fix that.
When key inputs are unknown, do not guess harder. Run a small pilot, measure c, r, and p_err, then re-run the model with observed numbers. A positive result is a hypothesis to validate, not a guarantee.
Your Next Step
Build the model with ranges, not points. Identify the one or two inputs that dominate the verdict. If those inputs are guesses, run the smallest pilot that measures them before committing to the build.
Instrument three numbers in a limited rollout: coverage, review rate, and error rate. Those three turn your first-pass estimate into a second-pass model grounded in observed behavior. The arithmetic does not change. The confidence behind it does.
Knowledge check
Final check
Finish the article by checking the ideas you just learned.
References
Want a more structured LLMOps path?
Use the LLMOps Practical Starter Bundle to connect RAG, evaluation, observability, and production patterns.
Large Language Models Starter Pack
A 12-chapter guide connecting LLM fundamentals with prompting, RAG, agents, tool calling, evaluation, security, and application engineering.
- 227-page Illustrated PDF edition
- 12 guided LLM engineering chapters
- Visual concept diagrams
- Self-assessment quizzes
- Bonus deep-dive sections
- Prompt design, structured output, context windows & RAG pipelines
- Agents, tool calling, prompt injection, evaluation & application lifecycles
Coming soon


