
LLM Observability Explained: Tracing What Happened in a Real Run
A user reports a wrong answer. You open the logs and find a single line: the final output, with no record of how the system arrived there. The prompt that…

Key topics
A user reports a wrong answer. You open the logs and find a single line: the final output, with no record of how the system arrived there. The prompt that was sent, the documents that were retrieved, the tool that was called—all gone. You are staring at the result of a process you cannot see.
This is the moment when many builders discover that a single output is not enough to debug an LLM application. The answer is the symptom. The cause lives somewhere in the pipeline that produced it. LLM observability is the practice of capturing the evidence of that pipeline so you can reconstruct what happened, find where the run went wrong, and fix the layer that actually failed.
Why a Single Bad Answer Is Undebuggable
Traditional software logging records events: a request arrived, a query ran, a response was sent. That model works when the logic between events is deterministic and inspectable. LLM applications break that assumption.
An LLM run is not one event. It is a chain: prompt assembly, retrieval, tool calls, model calls, and final generation. Each step can fail independently, and each failure produces a different kind of bad output. A retrieval step that returns nothing relevant produces a confident but ungrounded answer. A tool call with malformed arguments produces an error or a wrong side effect. A poorly assembled prompt produces a response that ignores the instructions entirely.
The second problem is non-determinism. Run the same input twice and the model may produce different outputs. That means you cannot reliably reproduce a bad answer by rerunning the request. The practical consequence: if you did not record the actual run while it happened, you may never see that exact failure again.
Observability is the difference between wondering why something broke and knowing where it broke. For LLM applications, that distinction is not a luxury. It is the minimum condition for making the system repairable.
Traces and Spans: The Run, Reconstructed
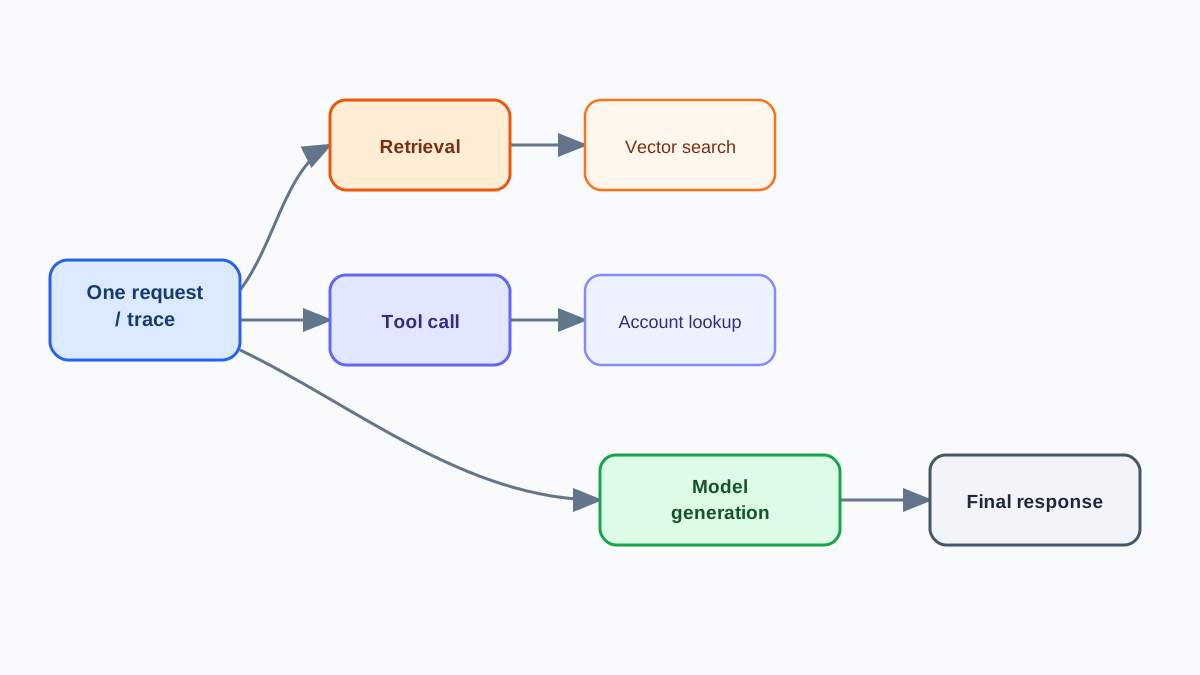
The core mental model in LLM observability is the trace. A trace is the full journey of one request, from the moment a user submits input to the moment the system returns a response. Think of it as a complete transcript of everything the application did to produce that answer.
A trace is composed of spans. A span is one slice of that journey: a single model call, a retrieval query, a tool execution, or a database lookup. Each span carries its own timing, inputs, outputs, and attributes—labels or metadata attached to that step so you can inspect what happened there.
A useful way to picture this is a tree. The trace is the trunk, and each span is a branch. A span can contain child spans: the model call that generated the final answer might itself have required a preceding tool call, and that tool call might have required a database query. The trace preserves that nesting, so you can see not just what happened, but in what order and with what dependencies.
This structure is what separates a trace from a pile of logs. A log records an event. A trace groups related operations and preserves their nesting and timing. That distinction matters when you debug: a log tells you that something happened, while a trace tells you where that something sat in the chain and what it depended on.
Knowledge check
Check your understanding
Answer this question before you continue.
Reading a Real Run: The Support Chatbot
Let us follow one bad run from start to finish. A user asks a customer-support chatbot: "Can I get a refund for my last order?" The application:
- Retrieves relevant policy documents from a vector database.
- Calls a tool to look up the user's account status.
- Sends the retrieved documents, the tool result, and the original question to the model.
- Generates a final response.
Each of those steps becomes a span. The retrieval query is a span. The tool call is a span. The model generation is a span. They all nest inside one trace that represents the entire request.
Now suppose the chatbot answers: "Yes, you are eligible for a full refund on any order within 90 days." The user replies that this is wrong—their order was placed 120 days ago.
Here is how you read the trace top to bottom:
Step 1: Check the retrieval span. The trace shows the retrieval query returned three policy documents. You inspect them and find that none of them mention the 90-day window. The model never saw the relevant policy. That is your first decisive anomaly.
Step 2: Check the tool span. The account lookup succeeded and returned the correct order date. The tool is not the problem.
Step 3: Check the model span. The prompt included the three retrieved documents, the account data, and the question. The model answered from what it had—and what it had was missing the policy that would have changed the answer.
The trace did not tell you the model was wrong. It told you the model never had the evidence it needed. That is a retrieval failure, not a generation failure, and the fix is completely different for each.
Note: A trace narrows and tests hypotheses. It does not prove why a model selected a particular token, and it does not guarantee a single root cause. In this run, the retrieval gap is the clear suspect. You confirm it by fixing retrieval and checking whether the failure disappears across similar cases.
Knowledge check
Check your understanding
Answer this question before you continue.
What Evidence a Useful Trace Must Capture
A trace is only as valuable as the evidence it records. Capturing the wrong data gives you a detailed record of nothing useful. Here is what a useful trace must include, organized by the question each piece of evidence answers.
A run identifier and structure. Every span needs to belong to the same request, with a parent-child relationship, start and end times, and an outcome or error status. This connective tissue is what turns scattered records into a trace. Without it, you have logs, not a reconstructable run.
The exact prompt sent to the model. LLM applications are prompt-sensitive. Small differences in wording, ordering, or included context change outputs. If you do not record the exact prompt, you cannot know what the model actually saw. This is the difference between debugging what you think you sent and debugging what you sent.
Retrieval results. If your application uses retrieval, record which documents were returned and in what order. This tells you whether the model never had the evidence it needed, or had the evidence and failed to use it. That distinction separates a retrieval failure from a generation failure.
Tool calls. Record the arguments sent to the tool, the result returned, and any errors. Tool calls are the bridge between the model's intent and real-world action. If the model called a tool with malformed arguments, the first repair boundary is schema design and validation. If the tool returned an error, the fix belongs in the tool itself.
The model response and token usage. The response is the output you need to judge quality. Token usage feeds cost tracking and can reveal inefficiencies, like a model generating thousands of tokens when a few hundred would do.
Latency per span. Timing data shows where the seconds went. A slow final answer could come from a slow model call, a slow tool, a slow retrieval step, or all three. Without per-span latency, you cannot tell which one is the bottleneck.
Each piece of evidence answers a specific diagnostic question: Was the right context retrieved? Did the tool get the right arguments? Where did the seconds go? If a trace cannot answer those questions, it is not doing its job.
Knowledge check
Check your understanding
Answer this question before you continue.
From Observation to Fix: Three Failure Patterns
The payoff of observability is not the trace itself. It is what the trace lets you do: turn a vague complaint into a specific diagnosis and a targeted change.
| Symptom | What the trace likely shows | First repair boundary |
|---|---|---|
| Confidently wrong answer | Retrieval returned no relevant documents | Retrieval: chunking, embeddings, or search query |
| Tool call failed or caused a wrong side effect | Malformed arguments sent to the tool | Schema design and validation, not the prompt |
| Responses feel slow | One model call consumes most of the request time | Faster model, smaller prompt, or parallel calls |
The decision rule is simple: the trace tells you which layer failed, and the fix should target that layer first. Do not rewrite the whole system when the evidence points to one component.
That said, treat the first fix as a hypothesis, not a verdict. Malformed tool arguments can reflect model behavior, schema design, validation gaps, or upstream state. Poor retrieval can involve query construction, indexing, ranking, or missing source data. The trace tells you where to start looking. You confirm the cause by fixing that layer and verifying the result across similar cases.
This is also where observability connects to evaluation. Observability gives you per-run evidence: what happened on this specific request. Evaluation tells you whether a change helped across many runs. A trace tells you the retrieval failed on this question. An evaluation set tells you whether your retrieval fix improved performance across a hundred questions. You need both, but they answer different questions.
Knowledge check
Check your understanding
Answer this question before you continue.
What Observability Does Not Tell You
Observability has boundaries, and respecting them prevents expensive mistakes.
One trace shows one run. It cannot tell you whether the system is reliable across many inputs. A single successful trace proves only that the system worked once. A single failed trace proves only that it failed once. Neither is a verdict on the system as a whole.
A trace also shows what happened, not whether the output was good. It records the prompt, the retrieval results, and the response. It does not judge whether that response was accurate, helpful, or appropriate. Judging quality requires evaluation criteria and test cases applied across many runs.
The common mistake is fixing one traced failure and assuming the system is now dependable. You have fixed one instance of a failure mode. You have not proven that the failure mode is eliminated, or that other failure modes are not lurking. Observability surfaces the evidence. Evaluation generalizes it into a verdict about the system.
A Practical Starting Point for Early Builders
You do not need a sophisticated observability platform on day one. You need a first-pass capture plan that gives you the minimum evidence for every request. Here is the order I would implement it:
- Correlate the run. Attach a request ID to every span so you can group all evidence from one user request.
- Capture each boundary. Record the prompt, the retrieval results, and the tool arguments and results.
- Record timing and outcomes. Add start and end times per span, plus an error status where relevant.
- Inspect one failed trace. Pick a real bad answer and walk it top to bottom before adding more instrumentation.
The tooling can be simple. Many LLM frameworks expose traces through the OpenTelemetry standard, which means you can plug into a range of observability platforms without rewriting your application. If you are not using a framework with built-in tracing, structured logs can carry you a long way. The format matters less than the discipline of recording the evidence before you need it.
My rule is this: make the next bad answer cheap to diagnose. Capture the evidence before you need it, because you will not be able to capture it after the fact.
Before you ship another change, make sure you can reconstruct any run that produces a bad answer. Then, when a user reports something wrong, you will not be staring at a single log line wondering what happened. You will be reading the full story of the run, finding the broken layer, and fixing it with intention.
Knowledge check
Final check
Finish the article by checking the ideas you just learned.
References
Research updated Sep 7, 2026


