
LLM Evaluation Thresholds: Calculate False-Positive and False-Negative Tradeoffs
A threshold is not a quality setting you install. It is a bet you place on a population.

Key topics
A threshold is not a quality setting you install. It is a bet you place on a population.
The team ships a guardrail at "score >= 3 blocks." The eval set looks fine. Then production complaints and missed bad outputs arrive in ratios nobody predicted. The threshold did not change. The population did.
By the end of this article, you will be able to take a small confusion matrix, move the cut point, change the assumed base rate, and read off the false-positive and false-negative counts before shipping. That is the whole skill: turning a score threshold into an operational error count you can defend.
Why a Threshold Is Not a Model Property
A scorer ranks. A threshold decides. Those are separate objects, and conflating them is the most common mistake I see in LLM evaluation work.
The scorer produces a score for each item. The threshold converts that score into a binary action: block or allow, flag or accept, escalate or answer. Change the cut point and you have changed the decision without touching the scorer. Change the population the scorer runs against and you have changed the decision without touching either.
Two levers move your error counts:
- Where you cut. Lower the threshold and you catch more positives, but you also flag more negatives.
- What population you cut on. The same cut point produces wildly different error counts when the base rate of the positive class shifts.
This article assumes you already understand two prerequisites. Calibration tells you whether scores track correctness rates. Population weighting tells you that an overall score can hide subgroup behavior. I am not re-deriving either here.
One boundary is worth stating plainly, because it is easy to get backwards. You do not need calibrated scores to compute observed false positives and false negatives at a threshold. You need labeled outcomes and a relevant population. Calibration is a separate property, and it matters when you want to predict how those rates will behave on a new population or compare scores across models. The arithmetic in this article is empirical counting, not a calibration claim.
Note: Every number in this article is invented for teaching. Nothing here claims a score is calibrated, comparable across models, or transferable between tasks.
Notation and the Confusion Matrix You Will Reuse
Before the arithmetic, name the cells. Every threshold decision reduces to four counts.
| Predicted positive (flagged) | Predicted negative (allowed) | |
|---|---|---|
| Actually positive | True positive (TP) | False negative (FN) |
| Actually negative | False positive (FP) | True negative (TN) |
Operationally, for an output guardrail:
- True positive: a genuinely harmful output that gets blocked. Good.
- False positive: a legitimate output that gets blocked. The user sees a fractured experience.
- False negative: a harmful output that reaches production. The operator absorbs the damage.
- True negative: a legitimate output that passes. The system works.
From these counts, derive the rates:
- False-positive rate (FPR) = FP / (FP + TN). Of all legitimate items, what fraction gets flagged?
- False-negative rate (FNR) = FN / (FN + TP). Of all harmful items, what fraction slips through?
- Precision = TP / (TP + FP). Of everything flagged, what fraction was actually positive?
- Recall = TP / (TP + FN). Of everything positive, what fraction did you catch?
- Base rate (prevalence) = (TP + FN) / total. How common is the positive class in this population?
The base rate is the lever most people forget. It is not a property of your scorer. It is a property of the world your scorer runs in.
Here is the running example. A hypothetical output guardrail scores each response from 0 to 5, where higher means more likely harmful. I have a small labeled set of 20 cases: 6 genuinely harmful, 14 genuinely legitimate. The scores are invented. The arithmetic is real.
Knowledge check
Check your understanding
Answer this question before you continue.
Deriving Error Counts from a Fixed Score Distribution
Order the labeled cases by score, then walk the cut point down the list. At each cut, everything at or above the threshold is flagged.
Here is the fixed score list. Harmful cases are marked H, legitimate cases L.
| Score | Label |
|---|---|
| 5 | H |
| 5 | H |
| 4 | H |
| 4 | H |
| 4 | L |
| 3 | H |
| 3 | H |
| 3 | L |
| 3 | L |
| 2 | L |
| 2 | L |
| 2 | L |
| 2 | L |
| 1 | L |
| 1 | L |
| 1 | L |
| 0 | L |
| 0 | L |
| 0 | L |
| 0 | L |
Now compute the cells at three candidate thresholds. Only the cut point changes.
Threshold >= 4 (flag scores 4 and 5):
- Flagged: 5, 5, 4, 4, 4. Of these, four are H and one is L.
- TP = 4, FP = 1.
- Not flagged: 2 H and 13 L.
- FN = 2, TN = 13.
Threshold >= 3 (flag scores 3, 4, 5):
- Flagged: the five above plus 3, 3, 3, 3. Of the four new items, two are H and two are L.
- TP = 6, FP = 3.
- FN = 0, TN = 11.
Threshold >= 2 (flag scores 2 through 5):
- Flagged: the nine above plus four L items.
- TP = 6, FP = 7.
- FN = 0, TN = 7.
Read the tradeoff directly. Lowering the threshold from 4 to 3 converted two false negatives into true positives and one true negative into a false positive. Lowering it again from 3 to 2 caught nothing new and added four false positives. That last move is pure cost.
The monotone relationship is exact: lowering the threshold converts true negatives into false positives and false negatives into true positives; raising it does the reverse. Every step down the score list trades one error type for the other.
Translate back to system behavior. At threshold 4, one legitimate request gets blocked and two harmful outputs reach production. At threshold 3, no harmful outputs reach production, but three legitimate requests get blocked. Which is worse depends entirely on what a blocked request costs versus what a harmful output costs. The arithmetic does not answer that question. It only tells you the price of each option.
Common mistake: Reading the error counts off the eval set and assuming they hold in production. They hold only if the production base rate matches the eval set's base rate. It almost never does.
One assumption is doing quiet work here: the score ordering is treated as fixed and stable for this population. If the scorer's ranking shifts between runs, the whole table shifts. Threshold analysis on an unstable scorer is archaeology, not engineering.
Knowledge check
Check your understanding
Answer this question before you continue.
Changing the Base Rate Changes the Counts
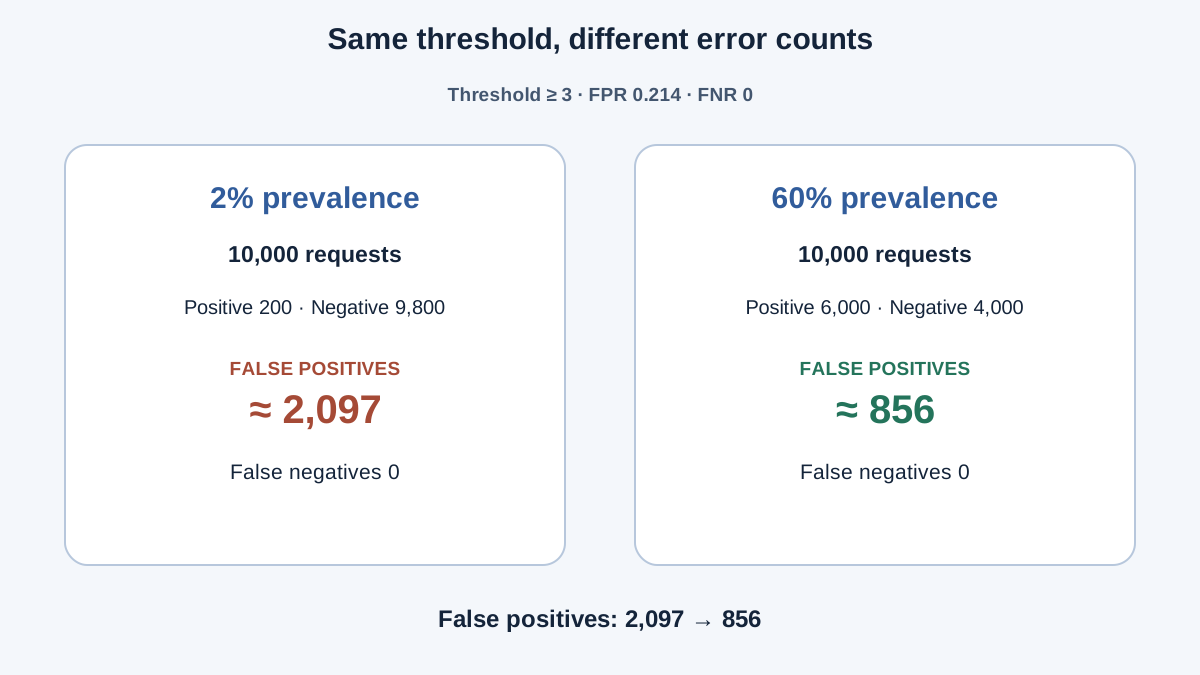
Now hold the threshold at 3 and the rates constant. Change only the population mix.
At threshold 3 on the 20-case set, FPR = 3/14 = 0.214 and FNR = 0/6 = 0. The base rate is 6/20 = 0.30.
Suppose production has a much lower base rate. Harmful outputs are rare: 2% of traffic instead of 30%. Run 10,000 requests through the same threshold with the same rates.
- Positives in the population: 0.02 x 10,000 = 200.
- Negatives: 9,800.
- False positives: 0.214 x 9,800 = about 2,097.
- False negatives: 0 x 200 = 0.
At the same threshold, the same scorer, the same rates, you now block roughly 2,097 legitimate requests to catch 200 harmful ones. Precision collapses to about 8.7%. When positives are rare, most flagged items are false alarms even at a good false-positive rate. This is the base-rate effect, and it is arithmetic, not opinion.
Now reverse it. Suppose the population is a high-risk channel where 60% of traffic is genuinely harmful.
- Positives: 6,000.
- Negatives: 4,000.
- False positives: 0.214 x 4,000 = about 856.
- False negatives: 0.
Same threshold. Same rates. The false-positive count drops from 2,097 to 856, and the operational story flips from "we are drowning in false alarms" to "we are catching nearly everything at acceptable cost."
Warning: This is arithmetic on assumed rates, not a claim that the rates transfer between populations. If your scorer behaves differently on the new population, the rates themselves change, and you must re-measure.
The lesson: a threshold tuned on a 30% base rate is not the same decision when deployed against a 2% base rate. The number on the config file is identical. The decision is not.
Knowledge check
Check your understanding
Answer this question before you continue.
Choosing a Threshold from Cost, Not from a Score
Stop asking "what threshold is correct." Ask "which threshold minimizes expected cost."
Write the decision as a comparison. At each candidate threshold, compute:
Expected cost = (FP count x cost of a false positive) + (FN count x cost of a false negative)
Work one comparison. Use the 20-case set, but scale to 10,000 requests at the 30% base rate so the counts are realistic. At threshold 4: FPR = 1/14 = 0.071, FNR = 2/6 = 0.333. At threshold 3: FPR = 0.214, FNR = 0.
- Threshold 4: FP = 0.071 x 7,000 = 497; FN = 0.333 x 3,000 = 999.
- Threshold 3: FP = 0.214 x 7,000 = 1,498; FN = 0.
Now plug in costs. Suppose a false positive costs 1 unit (a mildly annoyed user) and a false negative costs 10 units (a harmful output reaching production).
- Threshold 4: (497 x 1) + (999 x 10) = 497 + 9,990 = 10,487.
- Threshold 3: (1,498 x 1) + (0 x 10) = 1,498.
Threshold 3 wins decisively. Now flip the cost ratio: a false positive costs 10 units (a blocked paying customer in a critical workflow) and a false negative costs 1 unit (a low-stakes miss).
- Threshold 4: (497 x 10) + (999 x 1) = 4,970 + 999 = 5,969.
- Threshold 3: (1,498 x 10) + 0 = 14,980.
Threshold 4 wins. Same data, same thresholds, opposite conclusion. The cost ratio decided it, not the score.
This is why a single universal threshold is a weak default. The same cut point is defensible for a low-stakes recommendation filter and indefensible for a safety gate. The threshold is a decision you own, and the cost ratio is the input that makes it defensible.
Tip: Pick the threshold from the cost ratio and the expected base rate, then re-check it whenever either changes. A threshold is not a setting you install once. It is a decision you re-derive when the world moves.
The honest limit: cost ratios are estimates. You will not know the true cost of a false negative until one reaches production. So the output of this analysis is a defensible range of thresholds, not one magic number.
Knowledge check
Check your understanding
Answer this question before you continue.
Common Mistakes When Reading Threshold Results
These are the misreadings I see most often in eval reports.
- Reading error counts off the eval set and assuming they hold at production base rates. The eval set has its own prevalence. Production has another. The counts move.
- Treating a false-positive rate as if it were a false-positive count. A 5% FPR is 5 false alarms per 100 negatives, or 500 per 10,000. Volume and prevalence decide the operational pain, not the rate alone.
- Assuming a score is calibrated because the threshold "works" on one dataset. Then comparing that score across models or tasks. A threshold that works on one population tells you nothing about another.
- Optimizing the eval set instead of the decision. The threshold looks tuned while production behavior is unchanged. Hold out cases that never participate in tuning.
- Reporting a single accuracy number. Accuracy conceals the asymmetric cost of the two error types. A 95% accurate system can be useless if the 5% is all false negatives on a safety gate.
When This Analysis Helps and When It Does Not
Use threshold arithmetic when the decision is genuinely binary or can be reduced to one, the scorer produces a stable ordering, and you can estimate a base rate and a cost ratio. That covers most guardrails, most accept/reject graders, and most escalation triggers.
Do not use it when the score ordering is unstable across runs, when the task is open-ended quality with no defensible positive class, or when you have no labeled reference to anchor the rates. If you cannot yet say whether your scores track correctness, fix that first. Threshold arithmetic on uncalibrated scores produces confident nonsense.
Keep the claim narrow. This is a decision-analysis tool, not evidence that the underlying model is reliable. It tells you what a cut point costs. It does not tell you whether the scorer is any good.
Before you ship any threshold, write down three things: the assumed base rate, the two error costs, and the resulting counts at two candidate cut points. Then re-run the numbers when the population or the cost ratio changes. The threshold is a decision you own, not a setting the model hands you.
Your next practical step is to build a small evaluation harness that produces the labeled cases this arithmetic needs. Without labeled cases, you have no confusion matrix, and without a confusion matrix, you are guessing at the tradeoff.
Knowledge check
Final check
Finish the article by checking the ideas you just learned.
References
Want a more structured LLMOps path?
Use the LLMOps Practical Starter Bundle to connect RAG, evaluation, observability, and production patterns.
Large Language Models Starter Pack
A 12-chapter guide connecting LLM fundamentals with prompting, RAG, agents, tool calling, evaluation, security, and application engineering.
- 227-page Illustrated PDF edition
- 12 guided LLM engineering chapters
- Visual concept diagrams
- Self-assessment quizzes
- Bonus deep-dive sections
- Prompt design, structured output, context windows & RAG pipelines
- Agents, tool calling, prompt injection, evaluation & application lifecycles
Coming soon


