
How Evaluation Population Weights Change an LLM's Overall Score
Two teams run the same evaluation suite on the same two systems. One publishes a table where System A wins. The other publishes a table where System B…

Key topics
Two teams run the same evaluation suite on the same two systems. One publishes a table where System A wins. The other publishes a table where System B wins. No model changed. No prompt changed. No test case changed.
Only the assumed traffic mix changed.
That should bother you, because it means an aggregate benchmark score is not a property of a model. It is a property of a model under a stated population assumption — and that assumption is usually buried inside the aggregation rule, unprinted, unexamined, and quietly doing most of the work.
By the end of this article you will be able to write down the strata, the stratum scores, and the weights behind any aggregate number, recompute it under a different deployment mix, and watch a ranking flip on paper.
Why Two Teams Get Opposite Rankings From the Same Results
The default belief is simple and mostly wrong: an overall score is a property of the model, so a higher score means a better model. Under that belief, comparing two systems is just reading two numbers.
There is a narrow case where that belief holds. If the evaluation task mix genuinely matches your deployment population, and that mix is stable over time, then the aggregate is a reasonable summary of expected performance for your traffic. The belief is not stupid. It is just conditional, and the condition is rarely checked.
The hidden constraint is that the weights are baked into the aggregation rule. When someone averages 500 test cases, they are implicitly asserting that every case matters equally often. When someone reports a headline number from a benchmark, they are implicitly asserting that the benchmark's task distribution is the one you care about. Neither assertion is printed next to the score. The score arrives clean, decimal and confident, with its assumptions stripped off.
So when two teams disagree, the disagreement usually is not about the models. It is about which population each team silently assumed.
Task Strata, Stratum Scores, and Population Weights
Let's make the hidden machinery visible. Three objects do all the work.
A task stratum is a group of evaluation cases that share a task type, risk level, or user intent. Short factual lookups are a stratum. Multi-step reasoning is a stratum. Safety-sensitive refusals are a stratum. A stratum is not an arbitrary bucket of leftover cases — it is a category you would defend as meaningfully different in behavior.
The stratum score is the mean score of the cases inside stratum . Two things matter here. First, the within-stratum aggregation rule is itself a choice: mean, pass rate, or geometric mean will give you different numbers. Second, is only meaningful if the cases inside the stratum are comparable on the same scale.
The population weight is the assumed share of real deployment traffic that falls into stratum . Weights are non-negative and sum to 1:
The weighted score is then:
Read that aloud in plain causal language: each stratum contributes to the total in proportion to how often you expect to meet it. A stratum you meet constantly pulls the score hard. A stratum you meet once a month barely moves it — no matter how badly it fails.
Note: The formula carries an assumption stack. Strata are disjoint (no case belongs to two), weights are fixed and known, and stratum scores are comparable on the same scale. Break any of those and the weighted sum stops meaning what you think it means.
Knowledge check
Check your understanding
Answer this question before you continue.
Deriving the Weighted Score Step by Step
Start with the unweighted mean over all cases. If you have cases and case scores , the mean is:
Now group the cases by stratum. Let stratum contain cases, so . The same sum, reorganized:
The inner term is exactly , the stratum score. The outer factor is the stratum's share of case count. So:
The unweighted mean is a weighted sum in disguise, with weights equal to each stratum's share of the test set. This is the punchline: the uniform-weight case is a special case, not a neutral default. Averaging every case equally silently asserts that every stratum matters equally often. If your real traffic is 80% short lookups and your test set is 33% short lookups, the plain mean is not neutral — it is wrong in a specific, directional way.
The general weighted form replaces with , the deployment-population share. Same algebra, different assumption.
What breaks the whole construction? Overlapping strata double-count cases, inflating whichever stratum sits in the overlap. Non-comparable stratum scales — one scored 0–1, another 1–10 — make the weighted sum a category error, not a number. And a stratum with very few cases produces an unstable that the weight then either amplifies into the headline or buries.
Knowledge check
Check your understanding
Answer this question before you continue.
Worked Example: One Score, Two Deployment Mixes
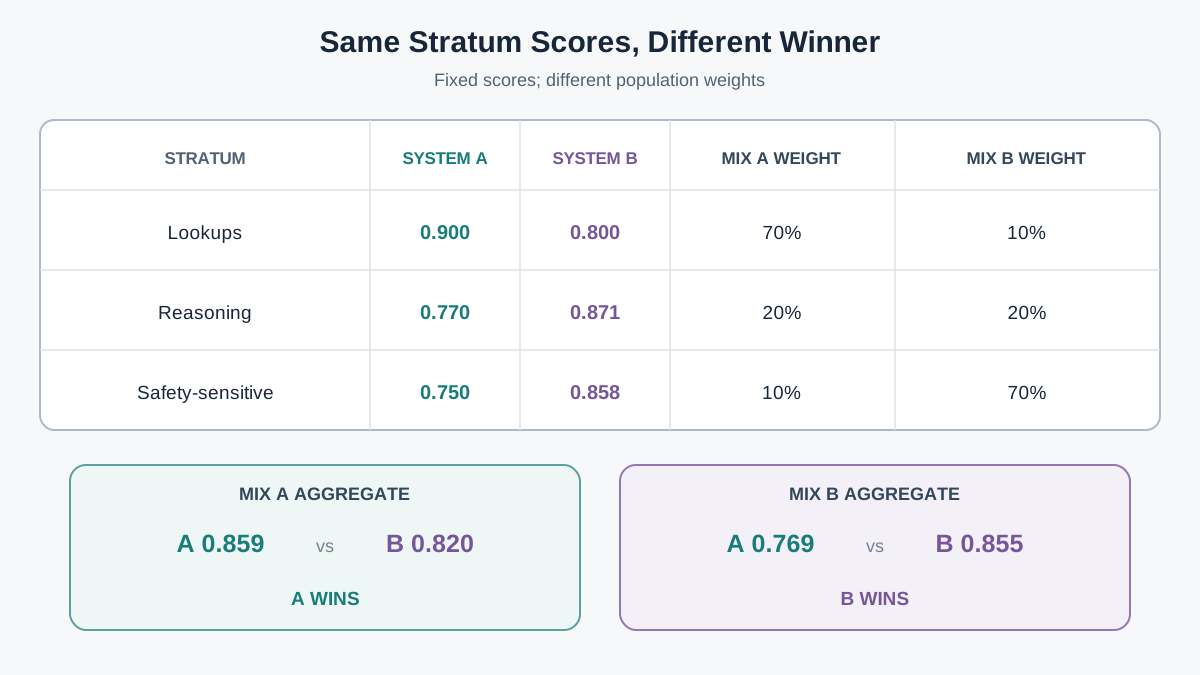
Three strata, two systems, two assumed populations. Every stratum score stays fixed throughout. Only the weights move.
| Stratum | System A | System B | Mix A weight | Mix B weight |
|---|---|---|---|---|
| Short factual lookups | 0.92 | 0.80 | 0.70 | 0.20 |
| Multi-step reasoning | 0.60 | 0.85 | 0.20 | 0.50 |
| Safety-sensitive refusals | 0.95 | 0.90 | 0.10 | 0.30 |
Mix A is a consumer chat profile: mostly quick lookups, occasional reasoning, rare safety-sensitive turns. Mix B is an internal analyst profile: heavy reasoning, more safety-sensitive content, fewer trivial lookups.
Under Mix A:
System A wins by roughly four points. The lookup stratum dominates, and A is much better at lookups.
Now recompute under Mix B:
System B wins by nearly nine points. Same models. Same stratum scores. The ranking flipped because the reasoning stratum went from 20% to 50% of the assumed traffic, and B is much better at reasoning.
Look at the contribution table to see which stratum is doing the work:
| Stratum | Mix A contribution (A / B) | Mix B contribution (A / B) |
|---|---|---|
| Short factual lookups | 0.644 / 0.560 | 0.184 / 0.160 |
| Multi-step reasoning | 0.120 / 0.170 | 0.300 / 0.425 |
| Safety-sensitive refusals | 0.095 / 0.090 | 0.285 / 0.270 |
Under Mix A, the lookup stratum contributes 0.644 of A's 0.859 — about 75% of the total. Under Mix B, reasoning contributes 0.300 of A's 0.769 and 0.425 of B's 0.855. The flip lives entirely in the weights.
Tip: When a ranking flips between two reports, do not re-run the models. Diff the weights first. The flip is almost always there.
Knowledge check
Check your understanding
Answer this question before you continue.
How an Overall Score Conceals Subgroup Behavior
The arithmetic above is not just a curiosity. It is a concealment mechanism, and it runs in both directions.
A high aggregate can hide a stratum where the system fails badly, as long as that stratum is rare under the assumed mix. System A scores 0.859 under Mix A while sitting at 0.60 on reasoning. If your users occasionally ask multi-step questions, that 0.60 is a real liability the headline number never mentions.
A low aggregate can hide a stratum where the system is excellent and which dominates your actual traffic. A system that scores poorly overall might be the best choice for a narrow, high-volume workload — if you re-weight to your own mix.
Weight sensitivity is the first failure mode. A point estimate is not enough. Report how much the score moves when weights shift within a plausible range. If a 10% shift in the reasoning weight moves the ranking, your conclusion is fragile and you should say so.
Small-stratum noise is the second. A stratum with few cases produces an unstable . A stratum with 12 cases and a 0.95 score is not evidence of reliability; it is a coin that landed heads twelve times.
Common mistake: Publishing a weighted score without the weights, the stratum scores, and the case counts beside it. A number without its assumptions is not evidence. It is a rumor with a decimal point.
Knowledge check
Check your understanding
Answer this question before you continue.
When Weighted Aggregation Helps and When It Misleads
Weighted aggregation is the right tool when three conditions hold: you have a defensible traffic estimate, your strata are stable over time, and the decision genuinely depends on expected-population performance. Under those conditions, the weighted score is the honest summary.
It misleads when you use it to compare systems across different populations. A score computed under Mix A and a score computed under Mix B are not comparable numbers, even if they look identical on a slide. It misleads when the weights are guesses dressed as measurements — a weight you cannot defend is an opinion with decimal places.
Now the boundary that trips people up. Not every safety-related number belongs in the weighted sum. There are two distinct things hiding under the word "safety," and they need opposite treatment.
Safety-related quality is performance on tasks that involve sensitive content but still have a graded quality dimension — how well a system handles a delicate medical question, how clearly it explains a risky procedure, how gracefully it redirects. That kind of performance is substitutable with other quality dimensions and can legitimately enter a weighted score. It is what the "safety-sensitive refusals" stratum in the example above represents: a quality score on sensitive turns, averaged like any other stratum.
A minimum safety requirement is different. It is a non-compensable gate: a specific policy violation, a prohibited output, a failure that must not be traded against arithmetic skill or latency. A gate does not get a weight. It gets a pass/fail check that runs before the weighted score is even computed. If the gate fails, the aggregate is irrelevant.
Warning: Keep minimum safety requirements as separate gates, not as weighted components. A system that trips a policy gate should fail outright, regardless of how well it scores elsewhere. Averaging is for substitutable quality; it is not for compliance.
So the example's refusal stratum is fine as a weighted component because it measures graded quality on sensitive turns. If you redefined that stratum to mean "did the system ever emit a prohibited output," it would stop being a weighted component and become a gate. Same label, different object, different treatment. Decide which one you are measuring before you decide where it goes.
The practical alternative I would ship: report a small vector of stratum scores plus one clearly labeled weighted summary, and let the reader re-weight it. That gives you the compression of a single number without hiding the structure underneath it.
Where the Weights Come From in Practice
Weights come from four places, and they carry different evidence strength. Production traffic logs are the strongest — they are observations. Product requirements are next — they are commitments. Stakeholder judgment is weaker — it is a belief. A deliberate uniform baseline is weakest of all, but it is at least honest about being a baseline.
State the provenance of the weights next to the score. "Weights from Q3 production traffic, n=48,000 requests" is a defensible line. "Weights from team discussion" is also fine, as long as you say so.
Revisit the weights when the product, user base, or feature mix changes. A stale mix silently invalidates every comparison built on it, and nothing in the report will warn you.
This article sits downstream of the case-construction work: the strata you weight are only as good as the representative cases inside them. It sits upstream of regression comparison, where you re-run the same weighted score across versions to catch quality drops. And it depends on keeping retrieval failures separate from generation failures, because a stratum score that mixes both will hide which layer actually broke.
The Next Move
Before you trust any aggregate score — yours or someone else's — ask three questions. What population does it assume? Is that population mine? What does the score hide?
Then do one concrete thing. Take an existing evaluation result, write down the stratum scores and the weights it implies, and recompute it under your own traffic mix. If the conclusion survives the re-weighting, you have evidence. If it flips, you just found the assumption that was making the decision for you.
Knowledge check
Final check
Finish the article by checking the ideas you just learned.
Want a more structured LLMOps path?
Use the LLMOps Practical Starter Bundle to connect RAG, evaluation, observability, and production patterns.
Large Language Models Starter Pack
A 12-chapter guide connecting LLM fundamentals with prompting, RAG, agents, tool calling, evaluation, security, and application engineering.
- 227-page Illustrated PDF edition
- 12 guided LLM engineering chapters
- Visual concept diagrams
- Self-assessment quizzes
- Bonus deep-dive sections
- Prompt design, structured output, context windows & RAG pipelines
- Agents, tool calling, prompt injection, evaluation & application lifecycles
Coming soon


